Two Amazing Statistical Anomalies?

Acylum

Well-Known Member
Nov 18, 2006
12,553
12,809
113
At least I think so but I'm looking for somebody smarter than me to decide. Sadly, last week we lost our first classmate from our graduating class of 1980. Our class size was 80. In discussing this with my parents, who both graduated in 1953 from the same class, they informed me that 25 of the 28 in their graduating class are still alive. I'm not sure which would be the rarer event. I'm hoping there's an actuary or statistician on the board.
 
I'd guess your parents class, but just a guess.
 
I'd say your parents situation, but also just a gut feeling.
 
We lost 2 classmates before graduation in a class of 47 (49) how does this fit in?
 
What are you considering the rare event in each case - death or survival? I assume you think it's rare for 1/80th from the Class of '80 to have died and rare for 25/28th from the Class of '53 to have lived?
 
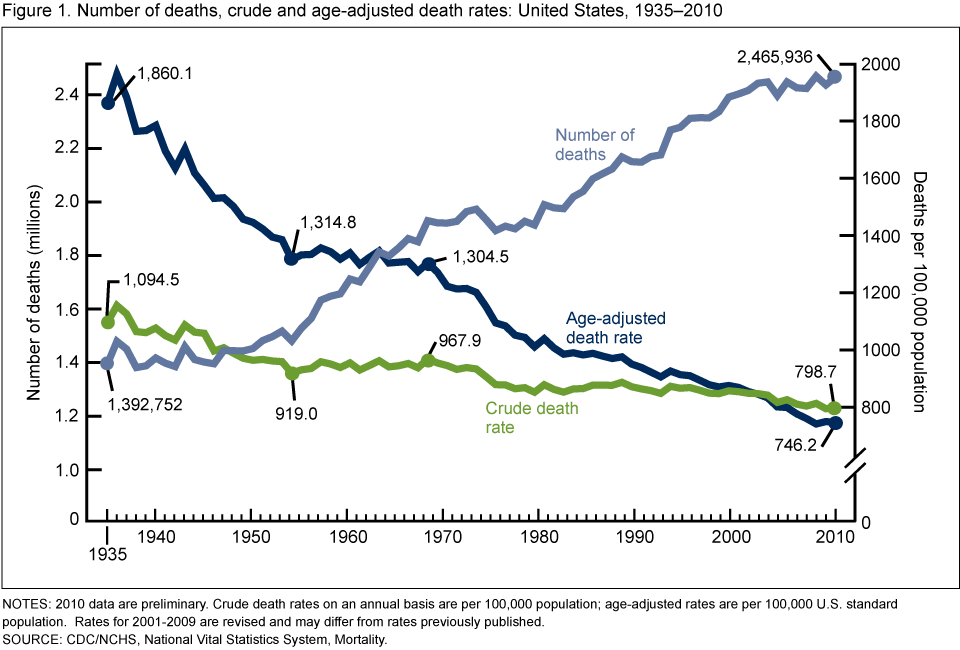
Since you and your parents come from two different populations from a death rate perspective, we'd need to know what percentage of people in each age group would have been expected to die in the given time period. My guess is that it's more rare for only 3/28ths of ~77 year olds to have died than 1/80th of 50 year olds, especially considering that your parents grew up during a time when death rates were much higher. While looking for some data, I found an article from the CDC saying that from 1935 - 2010, age-adjusted death rates in the US have declined 60%.

db88_fig1.png


Products - Data Briefs - Number 88 - March 2012
 
Last edited:
  • Like
Reactions: Acylum
I don't have any statistics but I'd go with your parents. I have no idea how many of my 300+ class has passed away.
 
What are you considering the rare event in each case - death or survival? I assume you think it's rare for 1/80th from the Class of '80 to have died and rare for 25/28th from the Class of '53 to have lived?
I think it's an extremely low number of deaths for both. Just seems like it to me anyway.
 
If I am reading the chart correctly, among those born in 1962 (Class of '80), 92.2% of males born alive are living and 95.5% of females are living, according to the SSA's 2007 data.

Among those born in 1935 (Class of '53), 56.5% of males are living and and 69.4% of females are living.

So out of a class of 80 (assuming equal distribution of male and female) in the Class of '80, 75.1 are expected to be still ailve. Of a class of 28 (assuming the same) in the Class of '53, 17.6 are expected to be still alive. So while both classes have out-lived expectations based on historical data covering the country as a whole, your parents' class has defied the odds slightly better.

I don't know why I just spent 15 minutes doing that.

edit: I just realized that I didn't take into account the small percentage of those who were already dead before high school. So this isn't perfect, but, hey, I only took one statistics class ever.
 
Last edited:
  • Like
Reactions: Acylum
What is the % of people in each class expected to be sex offenders? I'm uh...asking for a friend.
 

Help Support Us

Become a patron