

No forums found...
Site Related
Iowa State
College Sports
General - Non ISU
CF Archive
Install the app
How to install the app on iOS
Follow along with the video below to see how to install our site as a web app on your home screen.
Note: This feature may not be available in some browsers.
***Official 2022 Weather Thread***
- Thread starter wxman1
- Start date
No forums found...
Site Related
Iowa State
College Sports
General - Non ISU
CF Archive
You are using an out of date browser. It may not display this or other websites correctly.
You should upgrade or use an alternative browser.
You should upgrade or use an alternative browser.


Beautiful 80 degree afternoon to play some golf today. Sucks that it's about to get really hot for awhile
We will see if they are right but looks like a Hot August and a Warm September & October.
View attachment 100766
View attachment 100767
View attachment 100768
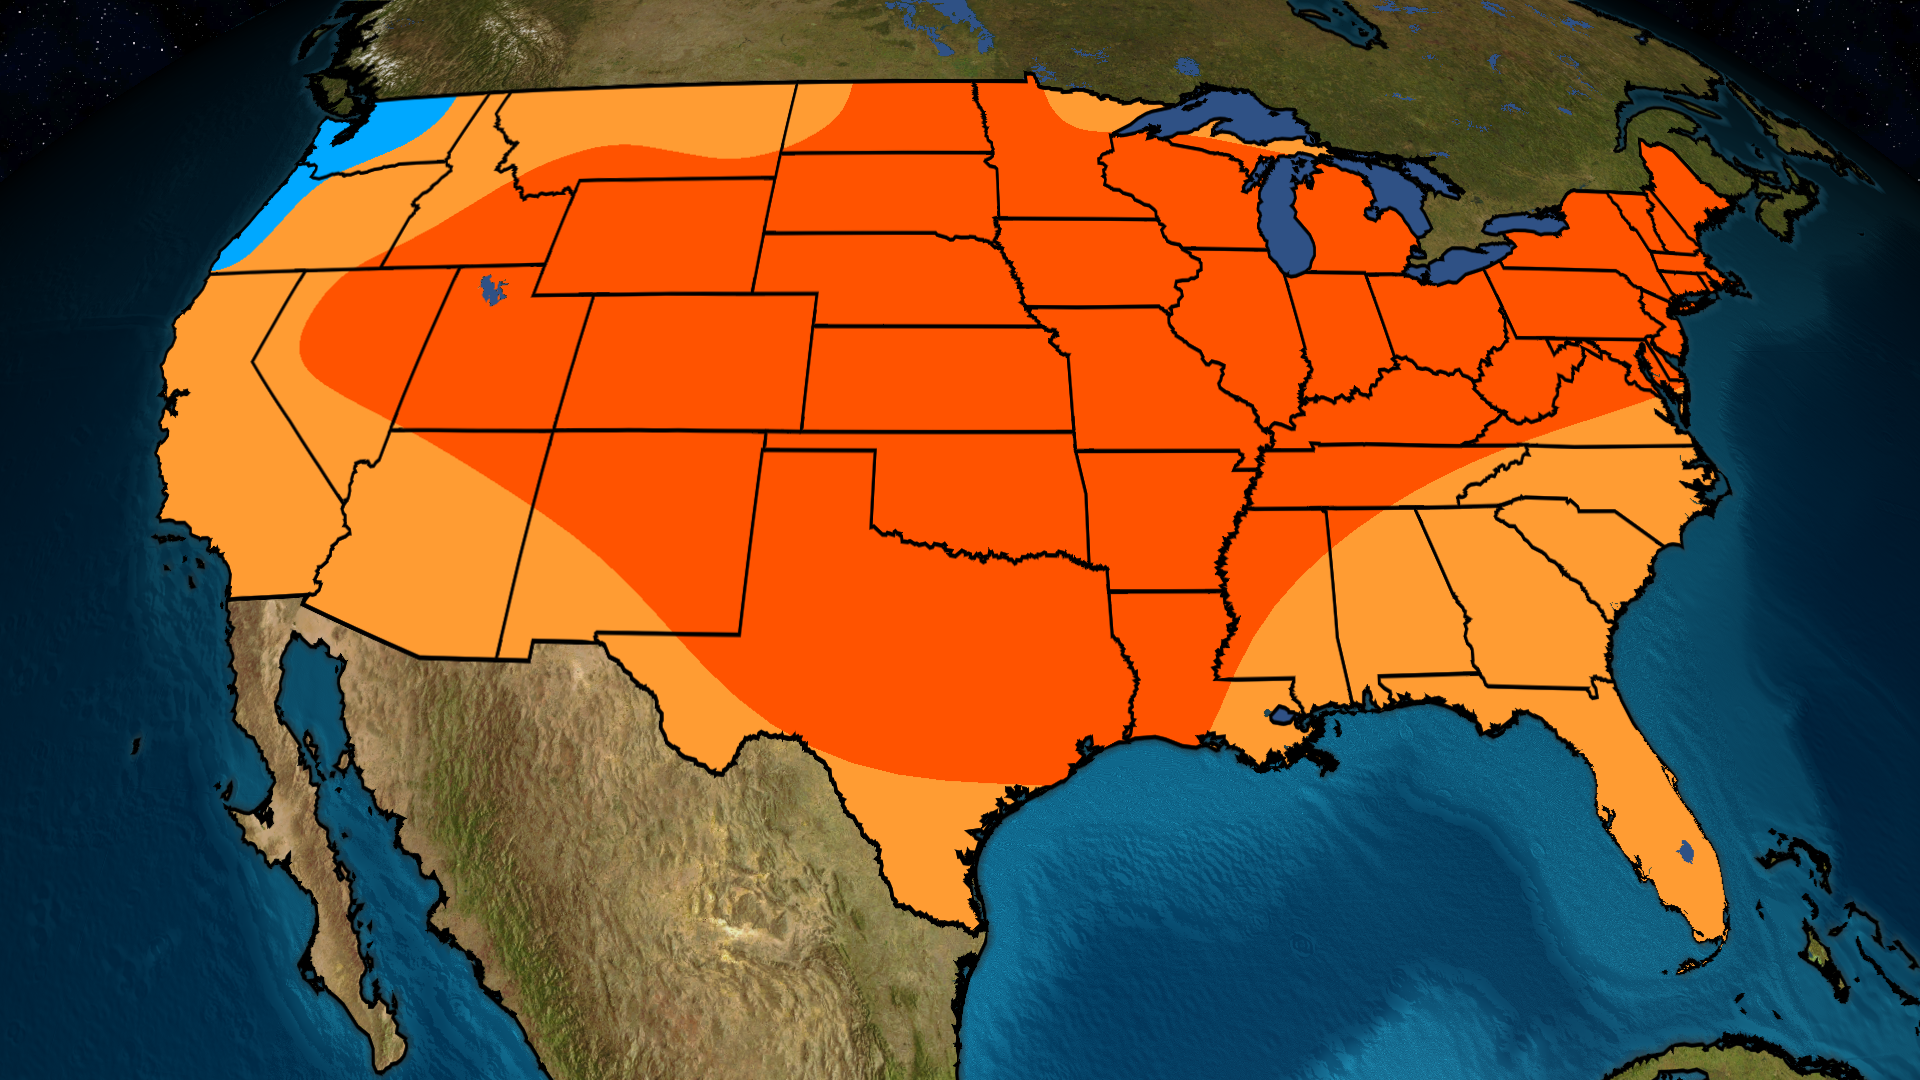
Summer Ends Hot In Central, Eastern U.S., But Fall's Start Has Changes | The Weather Channel
Here's how temperatures will play out as summer winds down and the first cold fronts of fall arrive. - Articles from The Weather Channel | weather.comweather.com
They need to redefine "average" since this might be the new norm.
They need to redefine "average" since this might be the new norm.
As far as I know the average is just a composite of all the temps on that day since the point they started collecting the data. Sadly, the averages will go up.
Gotta water the **** out of Sod. Especially during hot ass Iowa summer. Water it everyday, it’ll be worth it come next spring.I have sod that is less than a year old and it has already been getting it's ass kicked this summer. This isn't going to help.
I have sod that is less than a year old and it has already been getting it's ass kicked this summer. This isn't going to help.
Yeah mine is 11 months old right now. Still looks pretty good, but I am going to need to seed some places this fall.
When was that?As far as I know the average is just a composite of all the temps on that day since the point they started collecting the data. Sadly, the averages will go up.
When was that?
The NWS was founded in 1870 so that might be it.
I guess it depends on where you live as to when they consistently started keeping records.
And even though 150 years is just a grain of sand on the beach of time...........it's takes a lot to move the average much.
I would expect that the average value would be the 30-year climatological average, rather than the all-time average. Those get updated every decade. Currently, the US climate normals are based on 1991-2020.The NWS was founded in 1870 so that might be it.
I guess it depends on where you live as to when they consistently started keeping records.
And even though 150 years is just a grain of sand on the beach of time...........it's takes a lot to move the average much.
I would expect that the average value would be the 30-year climatological average, rather than the all-time average. Those get updated every decade. Currently, the US climate normals are based on 1991-2020.
That's interesting. Have to think why 30 years? Is there something scientific about that time frame that says ignore the past?
I don't know how they arrived at 30 years being the definition rather than some other time window. Having a rolling average, though (albeit decade-by-decade, rather than year-to-year), means that the technical definition of "what's normal" can evolve over time. I assume 30 years was considered long-enough to be stable and average-out the noise, while short-enough to be relevant.That's interesting. Have to think why 30 years? Is there something scientific about that time frame that says ignore the past?
If I was to take a guess, they likely decided on 30 years since it's generally accepted that if you have 30 samples in a dataset you can make several assumptions about those values having a Gaussian distribution (i.e., the "bell-curve"). I have no idea if that's an appropriate distribution for weather data, but Gaussian distributions often make lots of other math & analysis easier so as a result most folks shoe-horn everything into the traditional bell curve.
I don't know how they arrived at 30 years being the definition rather than some other time window. Having a rolling average, though (albeit decade-by-decade, rather than year-to-year), means that the technical definition of "what's normal" can evolve over time. I assume 30 years was considered long-enough to be stable and average-out the noise, while short-enough to be relevant.
If I was to take a guess, they likely decided on 30 years since it's generally accepted that if you have 30 samples in a dataset you can make several assumptions about those values having a Gaussian distribution (i.e., the "bell-curve"). I have no idea if that's an appropriate distribution for weather data, but Gaussian distributions often make lots of other math & analysis easier so as a result most folks shoe-horn everything into the traditional bell curve.
I can see that.
But I would think that might be a disservice because it would ignore the droughts and heat of the 80's when looking for comparables. Especially 83' and 88'. One doesn't need to go all the way back to the 30's to find this type of weather.
Very true. But at some point you have to draw the line and say 1988 (for example) is long-enough ago that you don't consider it in your definition of "normal" or "typical". No matter where you draw the line you're going to have someone say, "yeah, but what about (3 years before your line)". The discussion when we started down this rabbit hole was about how this year compares to average/typical/expected, so calling out a specific year (e.g., "what about 1988?") isn't the point.I can see that.
But I would think that might be a disservice because it would ignore the droughts and heat of the 80's when looking for comparables. Especially 83' and 88'. One doesn't need to go all the way back to the 30's to find this type of weather.
Considering specific prior years, though, can still be valuable and meteorologists will still consider individual years from the past to try and understand how the present may develop into the future. Basically, they'll recognize that 2022 has notable similarities to a collection of past years and then look at large-scale (i.e., continental-scale) trends in those years. Then, they can look at how those years developed. Nothing is a perfect analog, but this sort of re-analysis can give a sense of what types outcomes are likely. They're still comparing to an average, but they are trying to define an "average" that is perhaps a bit more representative of our current state rather than a blind 30-year average.
Nutrien Ag Solutions has regular videos on their YouTube channel (https://www.youtube.com/c/AgribleInc_TheInsightToDecide) that discuss weather models. There's a couple longer (25-min) videos each week with lots of discussion, and a daily shorter video that is focused on the near-term forecast. Their longer videos will often include some re-analysis where they identify similar years from the historical record and review how those years turned out, like what I described above. Look for videos labeled as "Ag Weather Forecast with Eric Snodgrass".
An estimated 50+ billion gallons of water evaporate (evapotranspiration) into the air from Iowa corn fields each day this time of year. Very helpful if you like the high heat index numbers...
Have a friend who said historical patterns are 89 years or something. Says that around 2025, we are going to get dust bowl level droughts again (so however exactly that would be). That is what is supposed to be for precipitation. Generally low precipitation means it’s warmer, since there air heats easier.I can see that.
But I would think that might be a disservice because it would ignore the droughts and heat of the 80's when looking for comparables. Especially 83' and 88'. One doesn't need to go all the way back to the 30's to find this type of weather.
An estimated 50+ billion gallons of water evaporate (evapotranspiration) into the air from Iowa corn fields each day this time of year. Very helpful if you like the high heat index numbers...
Interesting fact but, Yeah….. not so much.
I remember '88 specifically because it was the summer before college, and the heat extended into September and our dorm didn't have AC. Just miserable.I can see that.
But I would think that might be a disservice because it would ignore the droughts and heat of the 80's when looking for comparables. Especially 83' and 88'. One doesn't need to go all the way back to the 30's to find this type of weather.
What Europe is dealing with now with no A.C. over there.I remember '88 specifically because it was the summer before college, and the heat extended into September and our dorm didn't have AC. Just miserable.
BWR? Or are you and enginerd?I remember '88 specifically because it was the summer before college, and the heat extended into September and our dorm didn't have AC. Just miserable.